Multiple Choice
Identify the
choice that best completes the statement or answers the question.
|
|
|
1.
|
There are 12 sixth graders, 14 seventh graders, and 7 eighth graders in a gym
class. The gym teacher randomly selects one student to collect balls. In how many ways can choosing
not a seventh grader occur?
a. | 33 ways | c. | 19 ways | b. | 21 ways | d. | 14 ways |
|
|
|
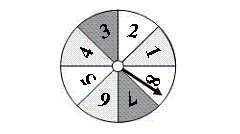
Use the spinner to determine the probability of the event.
|
|
|
2.
|
Not spinning a 4
|
|
|
3.
|
Spinning a number less than 10
|
|
|
You roll a number cube. Determine the theoretical probability of the
event.
|
|
|
4.
|
Rolling a 3
|
|
|
5.
|
Rolling a multiple of 2
|
|
|
The bar graph shows the results of spinning the spinner 40 times. Find the
experimental probability of the event.
|
|
|
6.
|
Spinning a 4 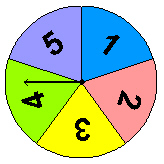 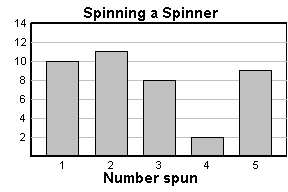
|
|
|
7.
|
Spinning a number greater than 1  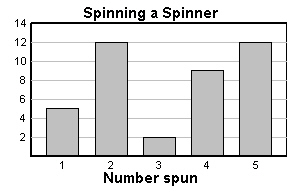
|
|
|
Use the Fundamental Counting Principle to find the total number of possible
outcomes.
|
|
|
8.
|
MP3
Player | | Memory | 1 GB, 2 GB, 4 GB , 8 GB, 16 GB, 32 GB | | Color | Purple, Black, White
| | |
|
|
|
You randomly choose one of the chips. Without replacing the first chip, you
choose a second chip. Find the probability of choosing the first chip, then the second
chip.
|
|
|
9.
|
Green and White 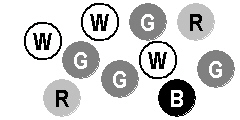
|
|
|
10.
|
White and not a Black 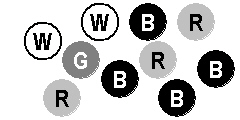
|
Short Answer
|
|
|
You randomly choose one of the tiles shown below. Find the favorable outcomes
of the event.

|
|
|
1.
|
Choosing an odd number
|
|
|
2.
|
Choosing a number divisible by 3
|
|
|
3.
|
You want to estimate the number of students who buy school lunch. You survey
students as they wait in line at the school cafeteria. Determine whether the sample is
biased or unbiased. Explain.
|
|
|
4.
|
The tables show the points scored by two school basketball teams during a
season. Team
A | 65 | 43 | 54 | 55 | 49 | 68 | 48 | 64 | 51 | 44 | 45 | 46 | 60 | 63 | 44 | 52 | 53 | 57 | 36 | 60 | 31 | | | | | | | |
Team
B | 77 | 67 | 86 | 87 | 63 | 89 | 68 | 86 | 90 | 76 | 67 | 90 | 75 | 83 | 62 | 64 | 75 | 89 | 69 | 60 | 72 | | | | | | | |
a. Compare the populations using measures of center and
variation.
b. Express the difference in the
measures of center as a multiple of each measure of variation.
|