|
|
|
1.
|
Compare the graph of 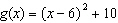 with the graph of  . a. | The graph of g(x) is a translation 6 units left and 10 units up from
the graph of f(x). | b. | The graph of g(x) is a
translation 6 units right and 10 units up from the graph of f(x). | c. | The graph of
g(x) is a translation 6 units left and 10 units down from the graph of
f(x). | d. | The graph of g(x) is a
translation 6 units right and 10 units down from the graph of
f(x). |
|
|
|
2.
|
Martha incorrectly graphed the function 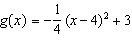 using
transformations of the graph of  . First she stated what transformations to
perform, and then she drew the graph. Describe any errors. (1) A vertical shrink by a factor of  (2) A shift left 4
units (3) A shift up 3 units 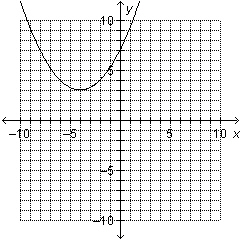
|
|
|
3.
|
Use this description to write the quadratic function: The parent function
 is vertically stretched by a factor of 6 and
translated 2 units right, followed by a translation 6 units up.
|
|
|
4.
|
If  , which of the following is equal to  ?
|
|
|
5.
|
Use symmetry to graph the quadratic function f(x) =
x2 – 4x – 2.
|
|
|
6.
|
Graph the quadratic function f(x) = (x + 1)(x +
2).
|
|
|
7.
|
Find the maximum value of each quadratic function. Then decide which function
has the greater maximum value. --Quadratic Function 1: The function whose equation is  . --Quadratic Function 2: The function whose graph is shown.  a. | The maximum value of Quadratic Function 1 is 4.
The maximum value of Quadratic
Function 2 is 0.
Quadratic Function 1 has the greater maximum value.
| b. | The maximum value of
Quadratic Function 1 is 4.
The maximum value of Quadratic Function 2 is 3.
Quadratic Function 1
has the greater maximum value.
| c. | The maximum value of Quadratic Function 1 is
–1.
The maximum value of Quadratic Function 2 is 3.
Quadratic Function 2 has the greater
maximum value.
| d. | The maximum value of Quadratic Function 1 is
–1.
The maximum value of Quadratic Function 2 is 0.
Quadratic Function 2 has the greater
maximum value.
|
|
|
|
8.
|
A rocket leaves a launcher at a height of 7 feet off the ground with an initial
velocity of 144 feet per second. The equation describing the rocket's height after t
seconds is 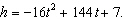 Find the maximum height reached by the rocket
and how many seconds it takes for the rocket to reach that height.
|
|
|
9.
|
Write an equation in standard form for a parabola with vertex 
and directrix  .
|
|
|
10.
|
Write an equation in standard form for a parabola with focus  and directrix  .
|
|
|
11.
|
A parabola has focus (4, 0) and directrix x =  4. Part A: What is the equation of the parabola? Part
B: Without graphing, tell the direction in which the parabola opens. How do you know?
|
|
|
12.
|
The graph shows the height  , in feet, of a football at
time  , in seconds, from the moment it was kicked at
ground level. Estimate the average rate of change in height from  seconds to
 seconds. 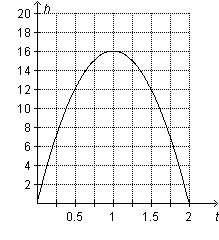 a. |  feet per second feet per second | b. |  feet per second feet per second | c. | 12 feet per second | d. | 20 feet per
second |
|
|
|
13.
|
Make a scatter plot of the data. Then find an equation of the quadratic function
that models the data. x | 1 | 2 | 3 | 4 | 5 | 6 | 7 | 8 | 9 | y | 8 | 14 | 22 | 32 | 44 | 58 | 74 | 92 | 112 | | | | | | | | | | |
|
|
|
14.
|
A satellite television receiver is a parabolic dish with an equation
of  . The receptor is placed at the focus. How far
from the vertex of the parabola is the receptor? Explain your reasoning.
|
|
|
15.
|
A spotlight uses a parabolic reflector, a surface with a parabolic cross
section, and a light bulb at the focus of the parabola. If the bulb is 2 inches from the vertex of
the reflector, what is the equation of the parabola? Explain your reasoning.
|
|
|
16.
|
An observatory has a large antenna to collect signals from space. The antenna
has a curved surface with a parabolic cross section, and a microphone is located at the focus of the
parabola. The microphone is 9.5 feet from the vertex of the parabola. Write an equation that can be
used to model the parabola. Explain how you found your equation.
|
|
|
17.
|
Consider the graph of 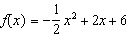 . Find the intercepts. Find
the vertex and state whether it is a minimum or a maximum. Determine the intervals where  is increasing and decreasing and the intervals where it is positive and negative.
|
|
|
18.
|
The table below gives the stopping distance y (in 100 meters) for a train
traveling on a track at various speeds x (miles per hour). | Speed, x
(mi/h) | 50 | 55 | 60 | 65 | 70 | 75 | 80 | 85 | 90 | | Distance, y (100 m) | 20 | 25 | 35 | 50 | 70 | 95 | 125 | 160 | 200 | | | | | | | | | | |
Find an equation of the quadratic function that
models the data, and predict the stopping distance for the train traveling at 95 miles per
hour. a. | 
about 245 hundred meters | c. | 
about 245 hundred meters | b. | 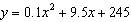
about 2,050 hundred
meters | d. | 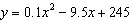
about 2,050 hundred meters |
|
|
|
19.
|
Audrey graphs a quadratic function. The graph of her quadratic function passes
through the points 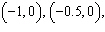 and  . Which
quadratic function could be Audrey’s function?
|
|
|
20.
|
The function f is a quadratic function whose graph opens upward and has
its vertex at (3, –4). The x-intercepts of f are 1 and 5. The function g
is also a quadratic function that passes through the points shown in the table below. x | g(x) | –3 | –4 | –2 | –5 | –1 | –4 | 0 | –1 | 1 | 4 | 2 | 11 | 3 | 20 | | |
Part
A: For each function, find the axis of symmetry of its graph. Explain how you found the axes
of symmetry and compare their locations in the coordinate plane. Part B: Function
f is represented by a verbal description. Function g is represented numerically in a
table. Are those the best representations for comparing the locations of the axes of symmetry? If so,
explain why. If not, how would you represent f and g to make their axes of symmetry
easier to compare?
|