|
|
|
1.
|
The depth of snow at seven different mountain lodges is 18 inches, 20 inches, 26
inches, 22 inches, 85 inches, 18 inches, and 24 inches. Find the mean, median, and mode. Which
measure is the most useful for predicting how deep the snow will be at an 8th lodge?
a. | mean: 30.4 in., median: 22 in., mode: 18 in.
The median is the most
useful. | b. | mean: 22 in., median: 30.4 in., mode: 18 in.
The median is the most
useful. | c. | mean: 22 in., median: 30.4 in., mode: 18 in.
The mean is the most
useful. | d. | mean: 30.4 in., median: 22 in., mode: 18 in.
The mean is the most
useful. |
|
|
|
2.
|
Raegan's first five geography test scores are 95, 95, 58, 68, and 61. What
misleading statistic could Raegan use to verify the claim that she is earning a good grade in
geography?
a. | the median of 68 | c. | the mean of 75.4 | b. | the mode of 95 | d. | the range of 37 |
|
|
|
3.
|
Rachel is applying for a summer job. The six current employees earn $9.00,
$9.50, $10.00, $10.50, $11.00, and $25.00 per hour. In the interview, the boss tells Rachel that the
average hourly wage is $12.50. Is the boss's statement misleading? Why or why not?
a. | Yes, because no one makes that exact amount. | b. | Yes, because only
one employee makes at least $12.50. | c. | No, because $12.50 is the mean, which is the
most reliable average. | d. | No, because $12.50 is the median, which is the
most reliable average. |
|
|
|
4.
|
By how much does the outlier in the following data set increase the mean of the
data set? Round your answer to the nearest hundredth if necessary.
{10, 14, 15, 20, 25, 27,
29, 30, 114}
a. | 21.25 | c. | 10.31 | b. | 14.25 | d. | 22.5 |
|
|
|
5.
|
By how much does the outlier in the following data set increase the range of the
data set?
{57, 79, 71, 84, 77, 38, 78, 72, 74, 85, 38, 81, 255}
|
|
|
6.
|
The number of calls received by a technical support center during 22 randomly
selected days is listed. Identify the outlier, and describe how it affects the mean and the standard
deviation.
50 | 57 | 77 | 66 | 50 | 57 | 77 | 66 | 53 | 72 | 51 | 88 | 82 | 70 | 62 | 64 | 69 | 88 | 98 | 65 | 11 | 68 | | | | | | | | |
a. | The outlier is 11. The outlier in the data set causes the mean to decrease from about
17.4 to about 13 and the standard deviation to increase from 65.5 to about 68.1. | b. | The outlier is 11.
The outlier in the data set causes the mean to decrease from about 68.1 to 65.5 and the standard
deviation to increase from about 13 to about 17.4. | c. | The outlier is 88. The outlier in the data set
causes the mean to increase from about 17.1 to about 17.4 and the standard deviation to
increase from 64.43 to about 65.5. | d. | The outlier is 88. The outlier in the data set
causes the mean to increase from 64.43 to about 65.5 and the standard deviation to increase from
about 17.1 to about 17.4. |
|
|
|
7.
|
Ms. Katz made the box-and-whisker plot below to show the distribution of her
students’ scores on their last science test. All of the scores were different and one score was
an outlier. 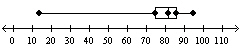 Which statement describes the most
likely effect on the mean and median test scores when the outlier is removed? a. | The mean score increases and the median score decreases. | b. | Both the mean and
median scores decrease. | c. | The mean score decreases and the median score
increases. | d. | Both the mean and median scores increase. |
|
|
|
8.
|
The box-and-whisker plots show the distribution of test scores for two students
for a semester. What conclusion can you make about the data? 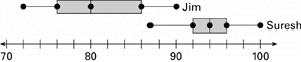 a. | Overall, Jim had better scores than Suresh, and Jim was more consistent in his
scores. | b. | Overall, Jim had better scores than Suresh, and Suresh was more consistent in his
scores. | c. | Overall, Suresh had better scores than Jim, and Jim was more consistent in his
scores. | d. | Overall, Suresh had better scores than Jim, and Suresh was more consistent in his
scores. |
|
|
|
9.
|
The ages of the U.S. Presidents that were inaugurated during the 1900s are given
below.
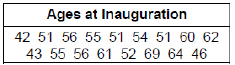 Look at the box-and-whisker plot of
these data below. What, if anything, is wrong with this box-and-whisker plot? 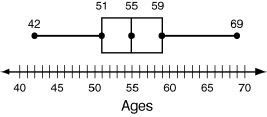 a. | The value of Q1 is incorrect. | c. | The value of Q3 is
incorrect. | b. | The median is incorrect. | d. | The box-and-whisker plot is correct. |
|
|
|
10.
|
The following data represents the ages of tenants in a particular apartment
building.
54, 37, 30, 37, 55, 38, 43, 37, 27, 28, 53, 39, 30, 41, 34
Part A: Find the minimum and maximum values and the first, second, and
third quartiles for the age data.
Part B: If the 55-year-old tenant moves out and a
56-year-old person moves in, how will this affect a box-and-whisker plot of the data?
Part
C: To the nearest whole percent, what percent of the tenants are 30 years old or older? To
the nearest whole percent, what percent are 43 years old or older? Explain.
|
|
|
11.
|
What is the best measure of center to use to compare the two data sets?
Data Set A 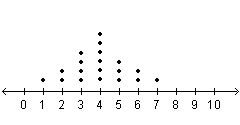 Data Set B 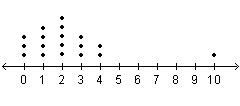 a. | Median | b. | Either the mean or the
median | c. | Interquartile range | d. | Either the standard deviation or the
interquartile range |
|
|
|
12.
|
The table below shows the average annual snowfall, in inches, for a particular
city for 16 randomly selected years between 1900 and 2000.
4 | 17 | 18 | 18 | 19 | 20 | 22 | 22 | 24 | 24 | 26 | 27 | 28 | 28 | 29 | 42 | | | | |
a.
Which values, if any, are outliers?
b. Describe the shape of the
given data set and the data set if the outliers are removed.
c. How
do the mean and median of the data set change if the outliers are removed? Explain.
|
|
|
13.
|
The table shows 8 randomly selected scores from the most recent test in three
different classes. Algebra 1 | Algebra 2 | Geometry | 72 | 65 | 0 | 75 | 70 | 68 | 76 | 72 | 73 | 81 | 75 | 75 | 82 | 75 | 79 | 86 | 81 | 80 | 92 | 93 | 84 | 95 | 94 | 89 | | | |
a.
Which statistics should be used to compare the center and spread of the three data sets?
Explain.
b. Compare the test scores of the three classes using a
measure of center and a measure of spread.
c. If only the data from
Algebra 1 and Algebra 2 are being compared, which statistics should be used? Explain.
|
|
|
14.
|
At State College, 491 juniors and seniors are taking a performing arts course.
216 sing in the chorus, 71 are in theater, and the rest are in dance. No one takes more than one
performing arts course. There are 114 juniors taking chorus, 32 seniors taking theater, and a total
of 235 seniors taking a performing arts course. Make a two-way frequency table for the data.
|
|
|
15.
|
Joyce asked 50 randomly-selected students at her school whether they have one or
more brothers or sisters. The table shows the results of Joyce’s poll. Make a table of the
joint and marginal relative frequencies. Express percentages in decimal form. 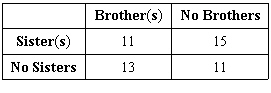
|
|
|
16.
|
A group of men and women were polled about whether they go to the gym regularly.
The joint and marginal relative frequencies corresponding to the results are shown in the two-way
table. 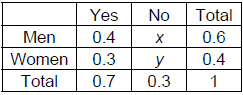 What of these is the value of
y?
|
|
|
17.
|
A survey of 120 students about which sport, baseball, basketball, football,
hockey, or other, they prefer to watch on TV yielded the following two-way frequency table. What is
the conditional relative frequency that a student prefers to watch baseball, given that the student
is a girl? Round the answer to two decimal places as needed. | | Baseball | Basketball | Football | Hockey | Other | Total | Boys | 18 | 14 | 20 | 6 | 2 | 60 | Girls | 14 | 16 | 13 | 5 | 12 | 60 | Total | 32 | 30 | 33 | 11 | 14 | 120 | | | | | | | |
a. | 11.67% | b. | 23.33% | c. | 43.75% | d. | 53.33% |
|
|
|
18.
|
Which of the following statements are supported by the survey data in the
two-way frequency table? | | Right-
handed | Left-
handed | Total | Males | 82 | 23 | 105 | Females | 79 | 16 | 95 | Total | 161 | 39 | 200 | | | | |
|
|
|
Choose an appropriate data display for the situation. Explain your
reasoning.
|
|
|
19.
|
a student’s quiz scores and how the scores are spread out
|
|
|
20.
|
the number of students that play each instrument in a school band
|
|
|
21.
|
Explain why the data display is misleading. 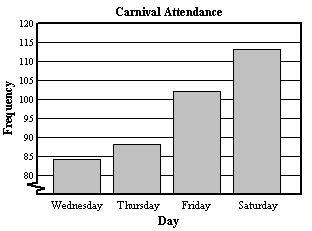
|
|
|
22.
|
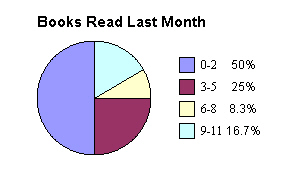
The frequency table shows the number of books that 12 people read last month.
Tell whether the data display is appropriate for representing the number of people that read books.
Books Read Last Month | Frequency | 0–2 | 6 | 3–5 | 3 | 6–8 | 1 | 9–11 | 2 | | |
|