|
|
|
1.
|
Which value best describes the data?
8, 9, 10, 12, 14, 15, 18, 18, 63
a. | mean | c. | median | b. | mode | d. | outlier |
|
|
|
2.
|
George's first five art history test scores are 86, 86, 60, 65, and 68.
What misleading statistic could George use to verify the claim that he is earning a good grade in art
history?
a. | the mean of 73 | c. | the mode of 86 | b. | the median of 68 | d. | the range of 26 |
|
|
|
3.
|
Jeana went shopping for a pair of jeans at the local store. The prices of ten
different pairs of jeans in the store were $18, $24, $32, $27, $35, $37, $28, $44, $24, and $51.
Which value(s) best represent(s) the data? Why?
a. | The mean of $32 or the median of $30, because both are close to the middle of the
set. | b. | The mean of $32, because it is not the lowest number. | c. | The mode of $24,
because it occurs the most often. | d. | The median of $36, because it is in the middle
of the numbers. |
|
|
|
4.
|
By how much does the outlier in the following data set increase the mean of the
data set? Round your answer to the nearest hundredth if necessary.
{10, 16, 17, 18, 21, 30,
135}
a. | 17.5 | c. | 16.62 | b. | 22.5 | d. | 18.67 |
|
|
|
5.
|
By how much does the outlier in the following data set increase the range of the
data set?
{85, 48, 85, 85, 67, 49, 38, 68, 73, 75, 68, 265}
|
|
|
6.
|
The number of calls received by a technical support center during 18 randomly
selected days is listed. Identify the outlier, and describe how it affects the mean and the standard
deviation. 50 | 57 | 77 | 66 | 53 | 72 | 51 | 88 | 82 | 70 | 62 | 64 | 69 | 88 | 98 | 65 | 14 | 68 | | | | | | |
a. | The outlier is 88. The outlier in the data set causes the mean to increase from about
17.8 to about 18.1 and the standard deviation to increase from about 65.1 to about
66.3. | b. | The outlier is 88. The outlier in the data set causes the mean to increase from about
65.1 to about 66.3 and the standard deviation to increase from about 17.8 to about
18.1. | c. | The outlier is 14. The outlier in the data set causes the mean to decrease from about
69.4 to about 66.3 and the standard deviation to increase from about 13.3 to about
18.1. | d. | The outlier is 14. The outlier in the data set causes the mean to decrease from about
18.1 to about 13.3 and the standard deviation to increase from about 66.3 to about
69.4. |
|
|
|
7.
|
Lisa is a fitness instructor. For one month, she recorded the number of people
who attended her aerobics class. She then used her data to make the box-and-whisker plot shown.
Lisa’s data set includes a single outlier and no duplicate data values. 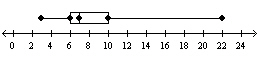 Which statement describes the effect on the range and interquartile range of
Lisa’s data set when the outlier is removed? a. | The interquartile range increases but the range decreases. | b. | The range and
interquartile range both decrease, but the interquartile range decreases more. | c. | The range decreases
but the interquartile range increases. | d. | The range and interquartile range both
decrease, but the range decreases more. |
|
|
|
8.
|
The box-and-whisker plots show the distribution of test scores for two students
for a semester. What conclusion can you make about the data? 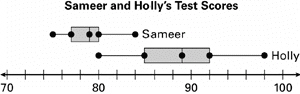 a. | Overall, Sameer had better scores than Holly, and Sameer was more consistent in his
scores. | b. | Overall, Sameer had better scores than Holly, and Holly was more consistent in her
scores. | c. | Overall, Holly had better scores than Sameer, and Sameer was more consistent in his
scores. | d. | Overall, Holly had better scores than Sameer, and Holly was more consistent in her
scores. |
|
|
|
9.
|
The high temperatures for Concord, CA, for October 1–15, 2005, are given
below.
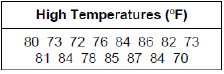 Look at the box-and-whisker plot of
these data below. What, if anything, is wrong with this box-and-whisker plot?  a. | The value of Q1 is incorrect. | c. | The value of Q3 is
incorrect. | b. | The median is incorrect. | d. | The box-and-whisker plot is correct. |
|
|
|
10.
|
The following data represents the ages of tenants in a particular apartment
building.
14, 32, 16, 24, 21, 33, 20, 23, 25, 15, 13, 19, 28, 20, 25
Part A: Find the minimum and maximum values and the first, second, and
third quartiles for the age data.
Part B: If the 33-year-old tenant moves out and a
36-year-old person moves in, how will this affect a box-and-whisker plot of the data?
Part
C: To the nearest whole percent, what percent of the tenants are 16 years old or older? To
the nearest whole percent, what percent are 25 years old or older? Explain.
|
|
|
11.
|
What is the best measure of center to use to compare the two data sets?
Grams of sugar per serving in cereal brand A:  Grams of sugar per
serving in cereal brand B:  a. | Median | b. | Either the mean or the
median | c. | Interquartile range | d. | Either the standard deviation or the
interquartile range |
|
|
|
12.
|
The table shows Amanda’s scores on her last
15 quizzes.
70 | 72 | 75 | 76 | 76 | 77 | 78 | 80 | 80 | 82 | 83 | 84 | 87 | 90 | 90 | | | | | |
Suppose on her next quiz, Amanda
scores a 96.
a. How does the shape of the data distribution
change if 96 is included?
b. How does the mean of the data set
change if 96 is included? the median?
c. How does the standard
deviation change if 96 is included? the interquartile range? Round your answers to the nearest
tenth.
|
|
|
13.
|
The annual salaries (in thousands of dollars) of 15 randomly selected employees
at two small companies are given. Indicate the shape of the data distributions. Then, compare the
center and spread of the data and justify your method of doing so.
Company
1:
22 36 37 37 37 39
39 42 42 45 45 46
46 150 200
Company 2:
21 37 38
38 38 39 42 45 45
46 46 47 48 62 250
|
|
|
14.
|
At State College, 493 juniors and seniors are taking a performing arts course.
213 sing in the chorus, 78 are in theater, and the rest are in dance. No one takes more than one
performing arts course. There are 98 juniors taking chorus, 37 seniors taking theater, and a total of
295 seniors taking a performing arts course. Make a two-way frequency table for the data.
|
|
|
15.
|
Joyce asked 50 randomly-selected students at her school whether they have one or
more brothers or sisters. The table shows the results of Joyce’s poll. Make a table of the
joint and marginal relative frequencies. Express percentages in decimal form. 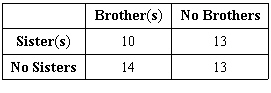
|
|
|
16.
|
A group of men and women were polled about whether they go to the gym regularly.
The joint and marginal relative frequencies corresponding to the results are shown in the two-way
table. 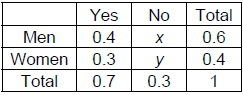 What is the value of x?
|
|
|
A magazine conducts a survey of a high school graduating class to ask whether
the students plan to attend a four-year college, attend a two-year college, enter the military, or
get a job. Match the situation with its value, based on the two-way frequency table, rounded to two
decimal places as necessary. | | Women | Men | Total | | Four-Year College | 63 | 75 | 138 | | Two-Year College | 12 | 18 | 30 | | Military | 8 | 10 | 18 | | Job | 15 | 10 | 25 | | Total | 98 | 113 | 211 | | | | |
a. | 0.06 | b. | 0.07 | c. | 0.09 | d. | 0.15 | e. | 0.4 | f. | 0.65 |
|
|
|
17.
|
The conditional relative frequency that a student plans to get a job, given
that the student is a woman
|
|
|
18.
|
The conditional relative frequency that a student is a woman, given that the
student plans to attend a two-year college
|
|
|
19.
|
The manager of a factory tested 50 items produced during each of the three work
shifts. The data are summarized in the two-way frequency table below. | | 1st shift | 2nd shift | 3rd shift | Total | Not
defective | 48 | 49 | 41 | 138 | Defective | 2 | 1 | 9 | 12 | Total | 50 | 50 | 50 | 150 | | | | | |
a. What
is the conditional relative frequency that a tested item is defective, given that it was produced
during the first shift? during the second shift? during the third
shift?
b. Does one shift seem more likely to produce a defective
product than the other two shifts? Explain using the results from part a.
|
|
|
Choose an appropriate data display for the situation. Explain your
reasoning.
|
|
|
20.
|
results of a survey asking students what type of shows they watch on television
where they could give more than one answer
|
|
|
21.
|
the average high temperature each month for a year
|
|
|
22.
|
Explain why the data display is misleading. 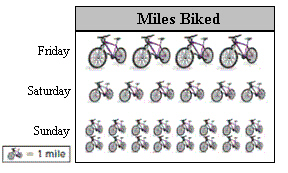
|
|
|
23.
|
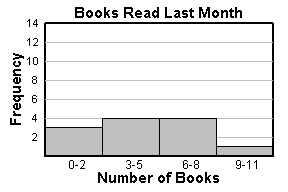
The frequency table shows the number of books that 12 people read last month.
Tell whether the data display is appropriate for representing the number of books read. Books Read Last Month | Frequency | 0–2 | 3 | 3–5 | 4 | 6–8 | 4 | 9–11 | 1 | | |
|