|
|
|
1.
|
The line plot shows the number of books 12 students read in Ms. Zuber’s
book club during the summer. Which measure of central tendency best describes the data? Justify your
answer. 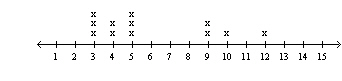 a. | The mean is 6. The mean best describes the data set because most people read less
than 6 books. | b. | The median is 5. The median best describes the data set because a majority of people
read 5 books. | c. | The modes are 3 and 5. The mode best describes the data set because it represents
half of the people. | d. | The range is 9. The range best describes the
data set because it represents the spread of the data. |
|
|
|
2.
|
Rolinda's first five music theory test scores are 99, 99, 62, 59, and 58.
What misleading statistic could Rolinda use to verify the claim that she is earning a good grade in
music theory?
a. | the median of 62 | c. | the mode of 99 | b. | the range of 41 | d. | the mean of
75.4 |
|
|
|
3.
|
The daily low temperature for ten consecutive days were 26°, 24°,
24°, 25°, 29°, 49°, 52°, 54°, 59°, 23°. Which measure of
central tendency best describes the average low temperature for the 10 days? Use this measure to find
the average low temperature.
a. | median; 39° | c. | median; 27.5° | b. | mode; 24° | d. | mean;
36.5° |
|
|
|
4.
|
By how much does the outlier in the following data set increase the mean of the
data set? Round your answer to the nearest hundredth if necessary.
{10, 12, 17, 18, 22, 30,
101}
a. | 17.5 | c. | 18.17 | b. | 11.83 | d. | 16.83 |
|
|
|
5.
|
By how much does the outlier in the following data set increase the range of the
data set?
{59, 70, 63, 46, 60, 38, 60, 51, 48, 85, 66, 55, 236}
|
|
|
6.
|
Two athletes run several miles each day to train. A random sample of their daily
distances is taken. Find the mean and standard deviation for each athlete. Use your results to make a
conclusion about the data. Round your answers to the nearest hundredth, if necessary.
Distances
(miles) | Athlete A | 3, 6, 5, 8, 4, 8, 6, 8, 9, 5, 5, 6, 7, 7, 3, 5, 5, 6, 7,
10, 3, 9 | Athlete B | 8, 9, 8, 8, 8, 4, 4, 4, 5, 5, 6, 15, 1, 3, 8, 4, 4, 8,
6, 10, 10, 10 | | |
|
|
|
7.
|
An oceanographer is measuring high tide against a mark he’s made on a
post. The results of several days of measurements are shown below. 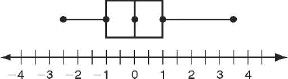 Which data set shows the heights of high tide over this period? a. | { , ,  , 0, 0, 0, 0, 1, 1,
3.5} , 0, 0, 0, 0, 1, 1,
3.5} | c. | { , ,  , ,  , ,
 , 0, 0, 0.9, 1.1, 3.5} , 0, 0, 0.9, 1.1, 3.5} | b. | { , ,
 , ,  , 0, 0, 1, 1, 2,
3.5} , 0, 0, 1, 1, 2,
3.5} | d. | { , ,  , ,  , ,  , 0, 1.5, 2, 2.5, 3.5} , 0, 1.5, 2, 2.5, 3.5} |
|
|
|
8.
|
The number of calls answered by a paramedic team over an 8-day period are given.
Use the data to make a box-and-whisker plot.
12, 6, 8, 15, 14, 6, 14, 10
|
|
|
9.
|
Seung used box-and-whisker plots to show the points he scored in his basketball
games this season. He used different plots for the home and away game data, and produced the graph
below. 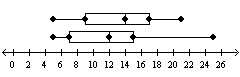 Unfortunately, Seung cannot remember which
plot represents the home game data and which represents the away game data. Which fact can he use to
determine which set of data was used to create each box-and-whisker plot? a. | Seung scored at least 5 points in every home game. | b. | The mode of the set
of away game scores was 14. | c. | Seung scored 23 points in an away game last
week. | d. | Seung played more home games than away games. |
|
|
|
10.
|
The box-and-whisker plot shows the original prices of shirts at a department
store. Make a double box-and-whisker plot of the data for the original data and the prices if $15 is
taken off the price. 
|
|
|
11.
|
The following data represents the ages of tenants in a particular apartment
building.
27, 32, 24, 32, 31, 31, 23, 33, 20, 31, 22, 23, 30, 30, 29
Part A: Find the minimum and maximum values and the first, second, and
third quartiles for the age data.
Part B: If the 33-year-old tenant moves out and a
36-year-old person moves in, how will this affect a box-and-whisker plot of the data?
Part
C: To the nearest whole percent, what percent of the tenants are 24 years old or older? To
the nearest whole percent, what percent are 31 years old or older? Explain.
|
|
|
12.
|
Suppose a probability distribution is represented by a histogram. Furthermore,
suppose you can draw a vertical line through the histogram that divides the histogram into two parts
that are mirror images. Which word is used to describe this distribution?
a. | binomial | b. | random | c. | skewed | d. | symmetric |
|
|
|
13.
|
What is the best measure of spread to use to compare the two data sets?
Income of ten recent graduates from college A (in thousands of dollars per
year):
0 35 38 39 45 47
50 51 52 52
Income of ten recent graduates from college B
(in thousands of dollars per year):
29 35 36 37
38 39 41 42 46 400
a. | Median | b. | Either the mean or the
median | c. | Interquartile range | d. | Either the standard deviation or the
interquartile range |
|
|
|
14.
|
What is the difference between the interquartile range of the data set
represented by the upper box plot and the interquartile range of the data set represented by the
lower box plot? 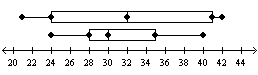
|
|
|
15.
|
The heights, in inches, of randomly selected members of a choral company are
given according to their voice part. Soprano
(in.) | Alto
(in.) | Tenor
(in.) | Bass
(in.) | 60 | 60 | 64 | 66 | 62 | 61 | 66 | 68 | 62 | 62 | 66 | 68 | 64 | 63 | 67 | 69 | 65 | 64 | 68 | 70 | 65 | 65 | 70 | 70 | 66 | 66 | 72 | 71 | 66 | 69 | 73 | 72 | 67 | 70 | 74 | 73 | 68 | 72 | 76 | 75 | | | | |
a.
Which two voice parts typically have the tallest singers? Explain why you chose the statistic you
used to compare the data sets.
b. Which two voice parts typically
have singers that vary the most in height? Explain why you chose the statistic you used to compare
the data sets.
|
|
|
16.
|
At State College, 458 juniors and seniors are taking a performing arts course.
217 sing in the chorus, 74 are in theater, and the rest are in dance. No one takes more than one
performing arts course. There are 87 juniors taking chorus, 33 seniors taking theater, and a total of
263 seniors taking a performing arts course. Make a two-way frequency table for the data.
|
|
|
17.
|
Joyce asked 50 randomly-selected students at her school whether they have one or
more brothers or sisters. The table shows the results of Joyce’s poll. Make a table of the
joint and marginal relative frequencies. Express percentages in decimal form. 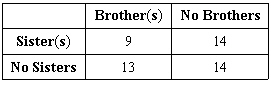
|
|
|
18.
|
At a small high school, there are 80 girls in the senior class. Some of them
play basketball, some play soccer, some play both, and some play neither. The table shows the joint
and marginal frequencies for the senior girls. If you know that a girl plays soccer, what is the
probability that she also plays basketball? Express your answer as a decimal. If necessary, round
your answer to the nearest hundredth. 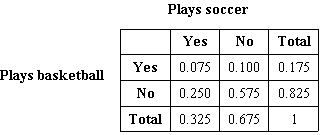
|
|
|
19.
|
A social media website surveys its members. The survey compares the number of
times per week a member logs into the website with the member’s age. The two-way frequency
table is shown below, where the columns represent the number of weekly log-ins and the rows represent
the member’s age. | | | 6-10 | | Total |  | 70 | 78 | 102 | 250 | | 18-29 | 100 | 150 | 170 | 320 | | 30-49 | 164 | 122 | 73 | 360 |  | 153 | 98 | 19 | 270 | | Total | 487 | 448 | 365 | 1200 | | | | | |
Melky states that the conditional relative
frequency that a member logs into the website between 6 and 10 times per week, given that the
member’s age is less than 18 years, is greater than the conditional relative frequency that a
member logs into the website between 6 and 10 times per week, given that the member’s age is
between 30 and 49 years. Is he correct? Explain by finding and comparing the conditional relative
frequencies. Round to two decimal places as needed.
|
|
|
Choose an appropriate data display for the situation. Explain your
reasoning.
|
|
|
20.
|
the revenue of a company each week
|
|
|
21.
|
results of a survey asking students if they are going on vacation
|
|
|
22.
|
Explain why the data display is misleading. 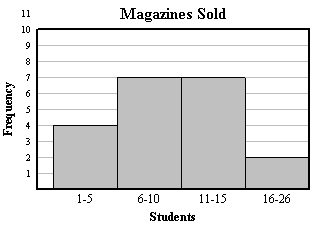
|
|
|
23.
|
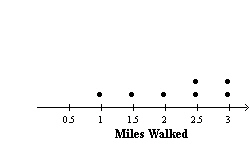
The table shows the number of miles walked last week. Tell whether the data
display is appropriate for representing the number of miles walked last week. Day | Sun | Mon | Tues | Wed | Thur | Fri | Sat | Miles
walked | 3 | 2 | 2.5 | 3 | 1 | 1.5 | 2.5 | | | | | | | | |
|