|
|
|
1.
|
Write an equation of the line. 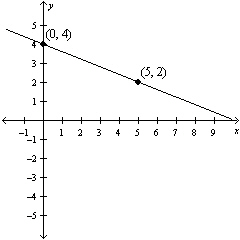
|
|
|
2.
|
An amusement park charges $5.00 for admission and $5.00 per ride. Write an
equation that gives the cost (in dollars) as a function of number of rides.
|
|
|
3.
|
In 1980 the average price of a home in Brainerd County was $92,000. By 1985 the
average price of a home was $112,000. Which of the following is a linear model for the price of a
home, P, in Brainerd County in terms of the year, t? Let t = 0 correspond to
1980.
|
|
|
4.
|
Write an equation of the line. 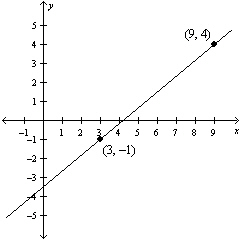
|
|
|
5.
|
An editor gets a $2220 raise each year. After working five years, she is making
$56,000 per year. Write an equation in point-slope form which models her income in terms of how many
years she has worked at the company.
|
|
|
6.
|
The cost to fill a car’s tank with gas and get a car wash is a linear
function of the capacity of the tank. The costs of a fill-up and a car wash for three different
customers are shown in the table. Write an equation for the function in slope-intercept form. Then,
find the cost of a fill-up and a car wash for a customer with a truck whose tank size is 30
gallons. Tank size (gal)
(x) | Total cost
($)
f(x) | 11 | 22.20 | 13 | 25.60 | 19 | 35.80 | | |
a. |  ; Cost for truck = $54.50 ; Cost for truck = $54.50 | b. |  ;
Cost for truck = $48.25 ;
Cost for truck = $48.25 | c. |  ; Cost for truck =
$19.76 ; Cost for truck =
$19.76 | d. |  ; Cost for truck =
$52.00 ; Cost for truck =
$52.00 |
|
|
|
7.
|
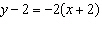
a. | Lines 1 and 2 are parallel. | c. | Lines 2 and 3 are
parallel. | b. | Lines 3 and 4 are parallel. | d. | All four lines are parallel. |
|
|
|
8.
|
Write an equation in slope-intercept form for the line parallel to y =
 x x + 6 that passes through the point
(–8, 6).
|
|
|
9.
|
Identify the lines that are perpendicular:  ;
 ;  ;
|
|
|
10.
|
Describe the correlation illustrated by the scatter plot. 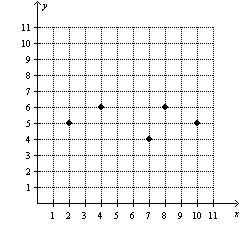 a. | no correlation | b. | negative correlation | c. | positive
correlation |
|
|
|
11.
|
Make a scatter plot of the data. Sketch a line that appears to best fit the
data. Then write the equation of the line. x | 3 | 6 | 5 | 2 | 7 | 4 | 8 | 1 | y | 6 | 10.5 | 8 | 2.5 | 14 | 7.5 | 14 | 1.5 | | | | | | | | | |
|
|
|
12.
|
Estimate the value of r for the scatter plot. 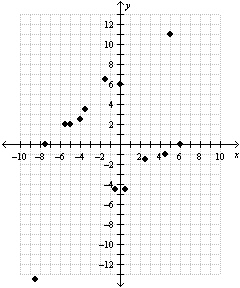 a. | 1.00 | c. | –0.30 | b. | 0.30 | d. | –1.00 |
|
|
|
13.
|
Glenalee is making home-made cards to send to friends and family and to sell at
the local craft fair. This scatter plot shows the total number of cards she had made after each hour
she worked on the task. 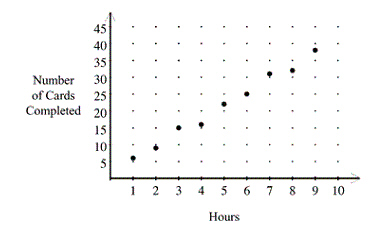 Using this information, what is the best
prediction of the number of cards Glenalee can make in 13 hours?
|
|
|
14.
|
This graph shows the scatter plot of a data set and a line of fit. 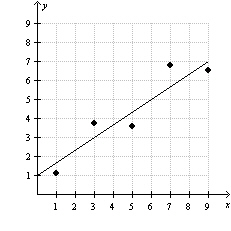 What is the residual plot for this data set and line?
|
|
|
15.
|
Which pair of statements is true?
a. | If two variables have a cause-and-effect relationship, then they are usually
correlated. However, two variables can be correlated but not have a cause-and-effect
relationship. | b. | If two variables have a correlation, then they probably have a cause-and-effect
relationship. However, two variables can have a cause-and-effect relationship and not be
correlated. | c. | If two variables have a correlation, then they must have a cause-and-effect
relationship. Similarly, if two variables have a cause-and-effect relationship, then they must be
correlated. | d. | If two variables have a cause-and-effect relationship, then they cannot be
correlated. Similarly, if two variables are correlated, they cannot have a cause-and-effect
relationship. |
|
|
|
16.
|
Find the 19th term in the following arithmetic sequence.
7, 14, 21, 28, 35,
...
|
|
|
17.
|
Find a function that describes the arithmetic sequence 4.5, 5.5, 6.5, 7.5, ...
Use y to identify each term in the sequence and n to identify each term’s
position.
a. | y = 5.5n –1 | c. | y = 3.5n
+1 | b. | y = 4.5n | d. | y = n + 3.5 |
|
|
|
18.
|
A repair service charges $55.00 to come to your home plus $18.50 per hour. Find
a function that describes the arithmetic sequence. Then find the total cost for a 7-hour job.
a. | y = 55.00n + 18.50; $403.50 | c. | y = 18.50n;
$129.50 | b. | y = 73.50n; $514.50 | d. | y = 18.50n + 55.00;
$184.50 |
|
|
|
19.
|
Evaluate the piecewise function 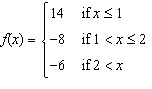 for 
and  .
|
|
|
20.
|
The output y of the greatest integer function is the greatest integer
less than or equal to the input value x. Explain why this is or is not the graph of the
greatest integer function. 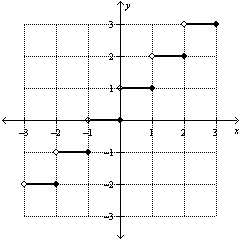 a. | This is the graph of the greatest integer function because the function takes an
input value and rounds up to the next integer. The greatest integer function rounds
up. | b. | This is not the graph of the greatest integer function because the function takes an
input value and rounds up to the next integer. The greatest integer function rounds
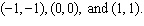
down. | c. | This is the graph of the greatest integer function because it includes the points
 The greatest integer function includes these
points. The greatest integer function includes these
points. | d. | This is not the graph of the greatest integer function because it includes the points
 The greatest integer function does not
include these points. The greatest integer function does not
include these points. |
|